Message from Steve Pettifer, Academic Lead, The Timetable Project
Thank you to everyone that took part in our second and final Timetabling Priorities survey. This post details how the results will help shape our future timetables.
Short on time? Read a key summary here
Last year the Timetable Project gathered views from staff and students on what factors make the best timetable. We received responses from 864 staff and 1656 students responded to the Timetable Project’s final survey, the results of which were used to create a ranked list of priorities. The headline results are:
- For staff and students, the timetabling process will prioritise distributing activities within the day to avoid more than 3 consecutive scheduled hours while also avoiding large gaps and allowing a lunch break between 12:00 and 14:00. These factors appear towards the top of student and staff rankings, have important wellbeing and inclusivity implications, and are also for the most part achievable.
- Having achieved the above where possible, the process will then attempt to minimise activities that start at 9am or finish at 6pm (something that's desirable for both staff and students, though somewhat harder to achieve in practice).
- The most important factor for staff - with 46% putting it in one of their top three choices - is to avoid fragmentation of the week to allow for other aspects of the job to be carried out effectively. The timetabling process will take into account, at the highest priority, the need to provide at least one day per week free of scheduled teaching for staff.
While we can't absolutely guarantee to accommodate even the very top priorities for everybody all of the time, we are confident that we can accommodate most of the top priorities for most staff and students most of the time. These results will shape our future timetables, starting with the 2023/24 timetable. They have been written into the Timetabling Code of Practice, to guide Faculty Scheduling teams.

Timetable Choice Outcomes
Thank you to everyone that took part in our recent survey of timetable preferences. Before we look at the results and outcomes, a quick reminder of the story so far…
Back in 2021, the University created The Timetable Project to improve the way we build our shared teaching timetable with the goal of producing a fairer, more stable timetable that could be published earlier in the year. As part of this project, we ran an initial survey to gather suggestions from across the University for desirable properties of our timetable. We suggested some example properties to get things going and asked staff and students to suggest extra ones that were added to the list. The second survey was then an opportunity for everyone to rank the list of items from most to least important. In this post, I'll discuss the results of this ranking exercise and explain how we'll use those results to shape our future timetables.
Before we look at the results though, a few caveats and caveat-like-things that I'd like you to keep in mind for the rest of this post:
- First, the numbers. We had responses from 864 staff and 1656 students. Splitting the results by school or faculty, the rankings are remarkably consistent, so I think there are some fairly safe conclusions to be drawn from the data we have. If you'd like to examine the results yourself in more detail, we've made the raw numbers available for you to download and explore(and if you spot something important that I've missed, especially something that might change the conclusions I've drawn lower down, please do let me know!)
- Second -- and remembering the categories used in the second survey were 'crowd-sourced' from staff and students in the first phase of this exercise -- there's scope for subjective interpretation of some of the categories (for example, how clumpy is clumpy?). We decided to keep the descriptors simple to keep the survey task simple, while accepting that this introduces some ambiguity and noise into the results.
- Third, there are some near-duplicates ('clump teaching', for example, is very similar to 'avoid fragmented days') and some near-opposites ('spread teaching throughout the day' is sort-of opposite to both of those) so it's not a pure and perfect list of beautifully independent or orthogonal concepts.
- Fourth, the second survey was designed to force a ranking from most to least important. What the survey doesn't do is try to assign an absolute importance value to anything, so while we can say that things towards the top are in some sense 'important', we can't say that things at the bottom are 'unimportant', just that they are less important than the things above them.
In combination these caveats mean that we mustn't read too much into the exact numerical rankings of items; we can safely say things towards the top are more important than things towards the bottom, but there's no point arguing about the exact relationship between near-neighbours or trying to give an absolute importance value to anything.
The results
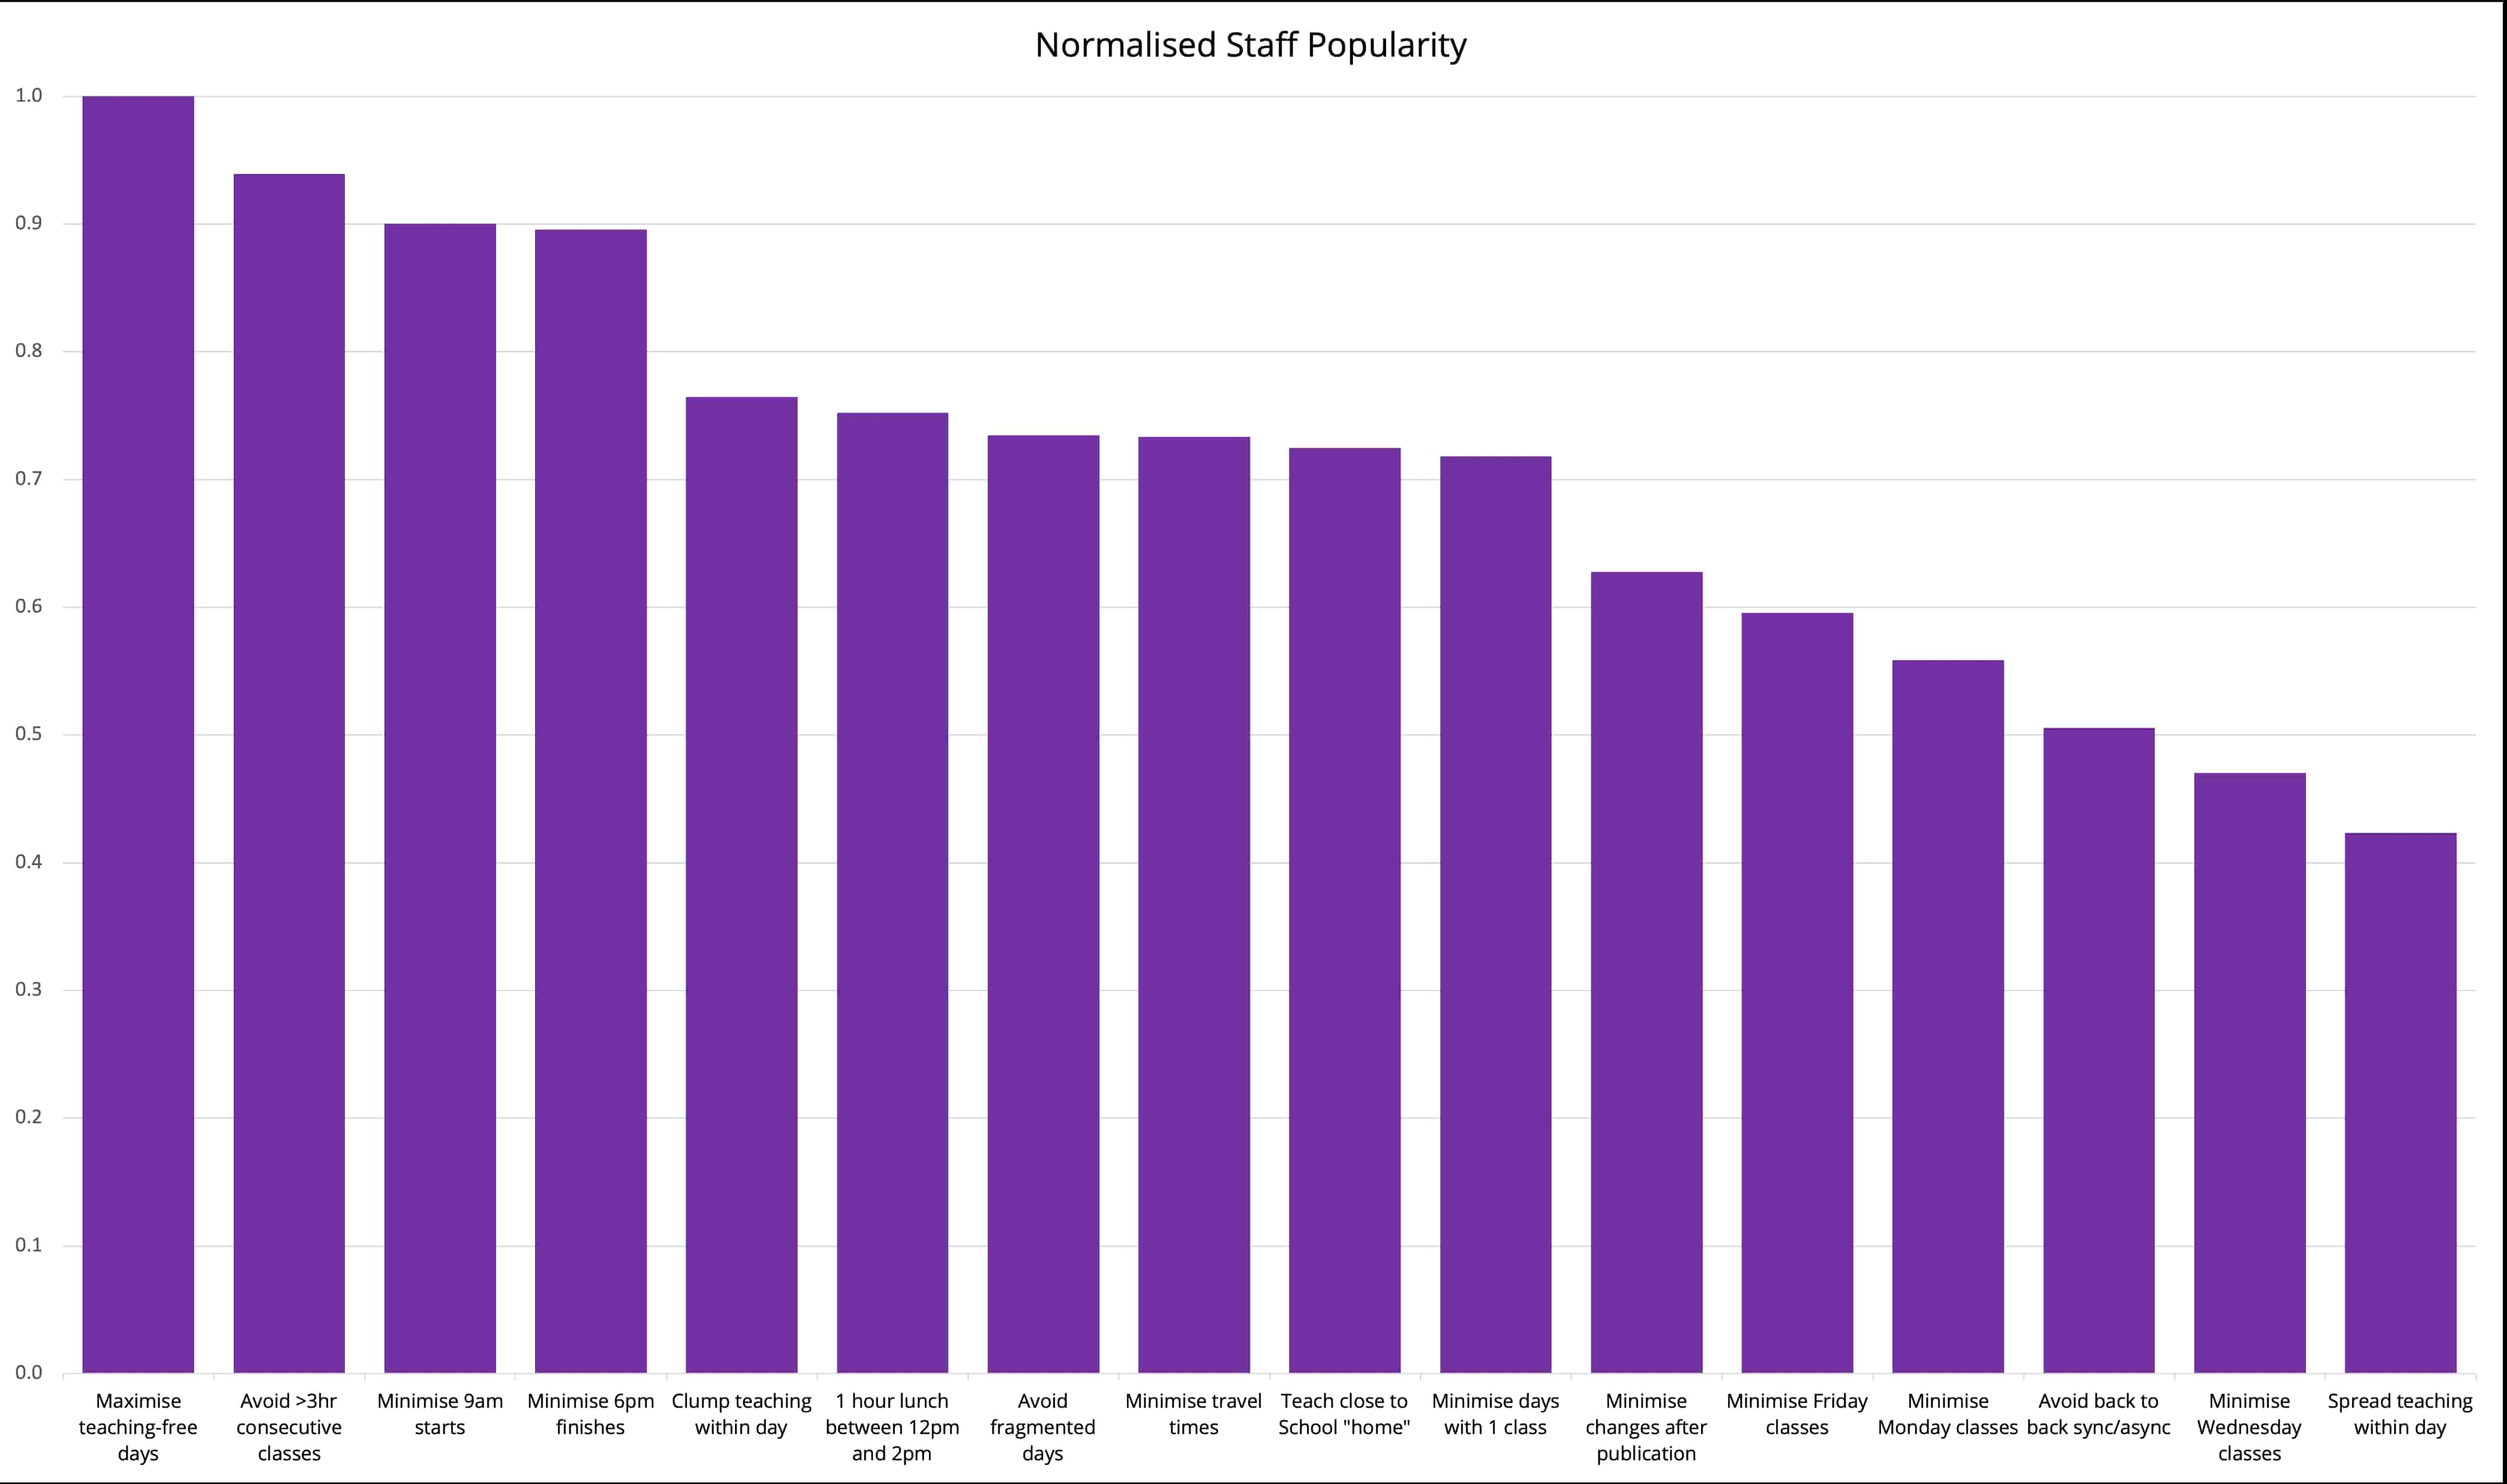
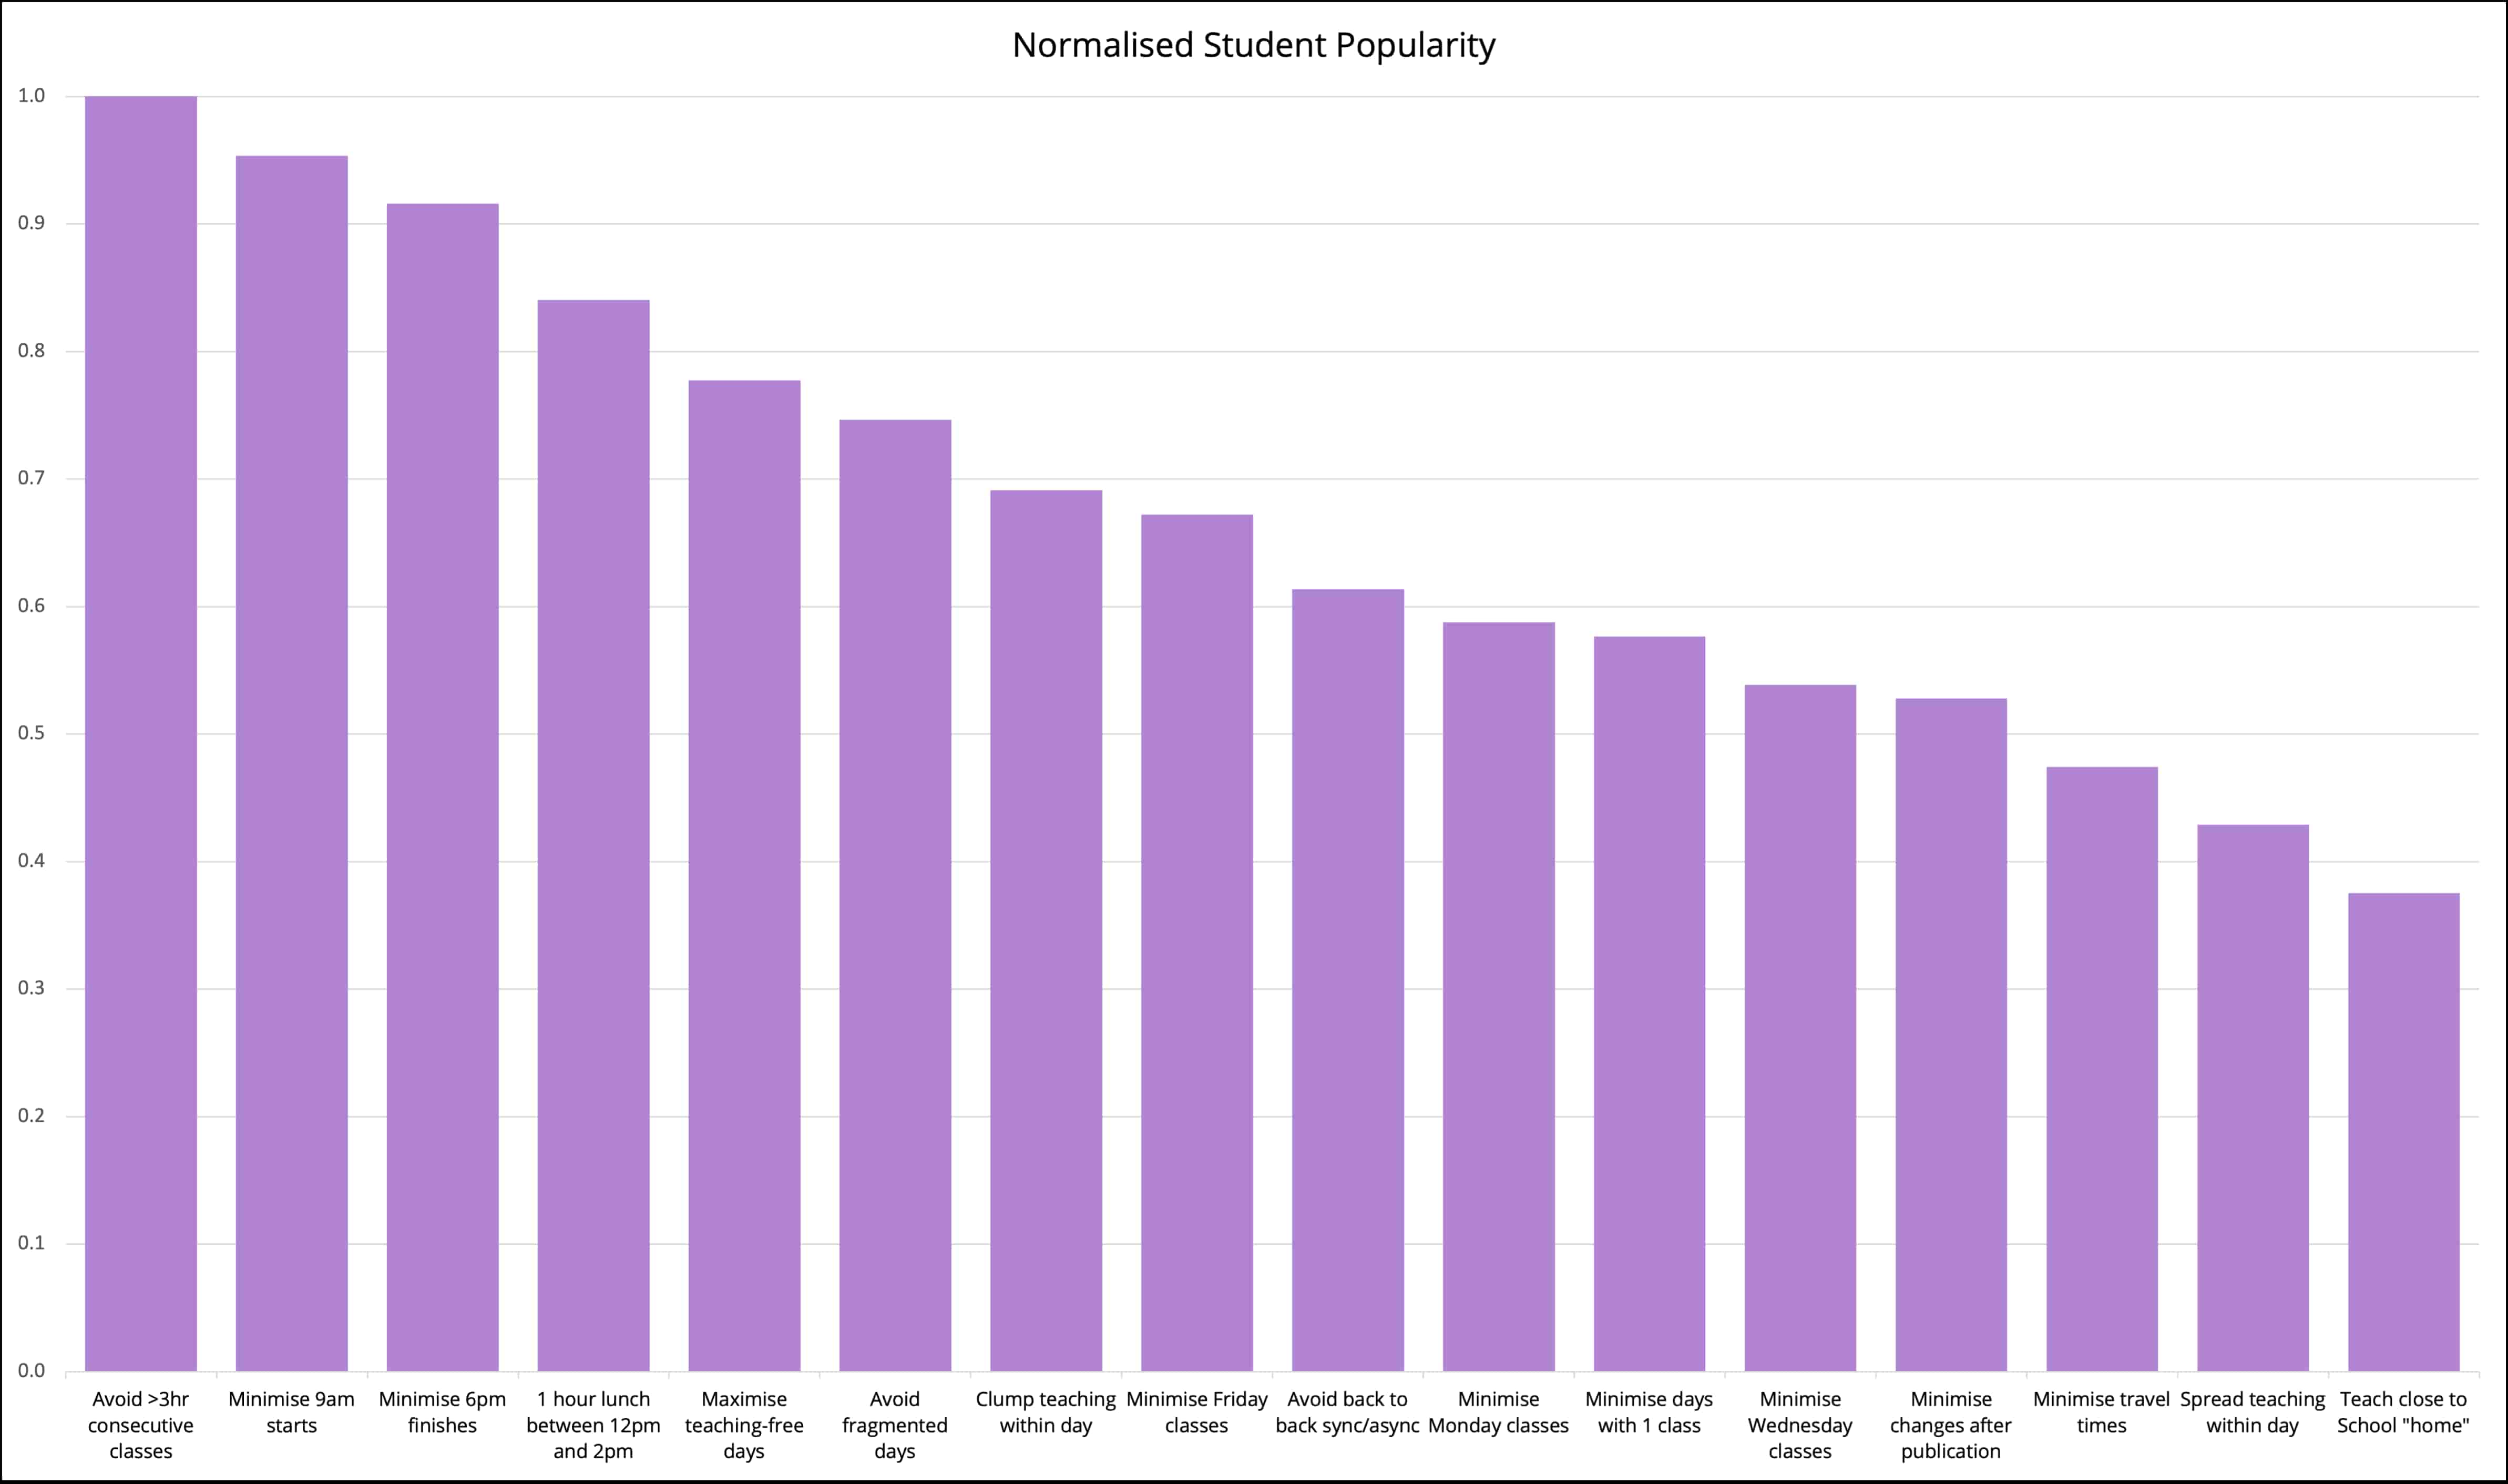
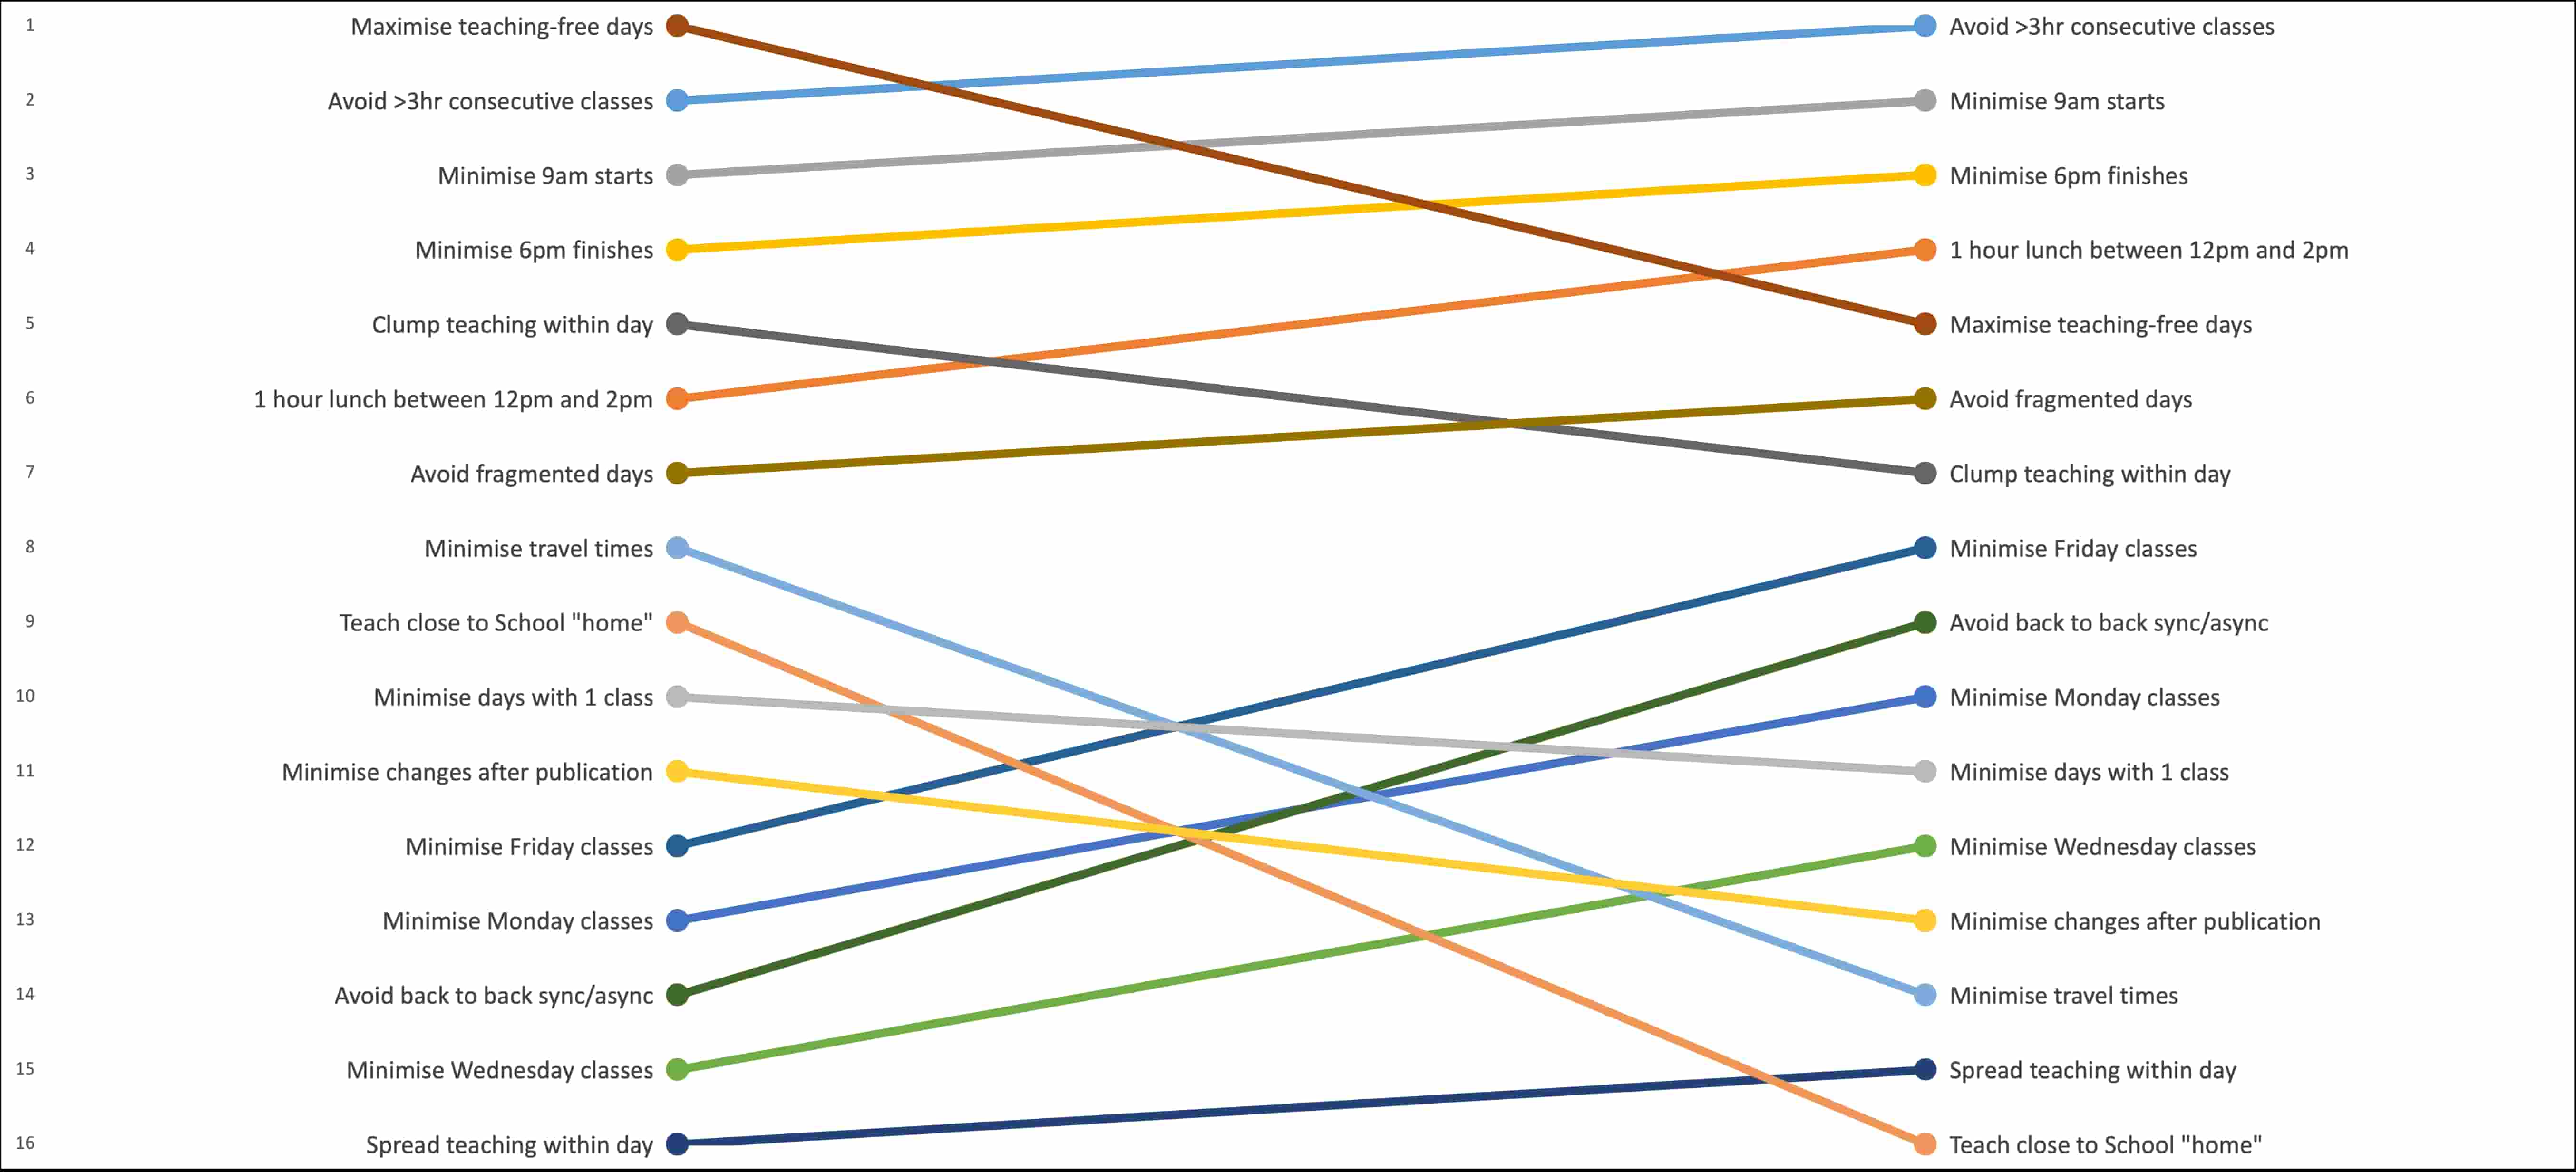
The bar charts in Figures 1 and 2 show the normalised popularity of the various options for staff and students. The slope chart in Figure 3 gives a visual representation that helps compare how both cohorts ranked the various items.
Towards the top of the rankings there's considerable agreement about priorities; avoiding long consecutive runs, 9am starts, 6pm finishes and including a lunch break appear towards the top of both staff and student rankings. If you take 'maximise teaching free days' out of the question then the top few priorities end up in even closer agreement (and yes, this might sound like cheating -- and to some extent it is -- but more on this later).
Overall, this is a really satisfying outcome, not only because there is a lot of agreement between what staff and students want, but also because the things that have ended up at the top of the rankings are for the most part consistent and compatible with each other and happen to be, again for the most-part, achievable. And by 'for the most-part achievable' I mean something like this: while we can't absolutely guarantee to accommodate even the very top priorities for everybody all of the time, we are confident that we can accommodatemost of the top priorities for most people most of the time. Exactly what that means in practice -- well, we'll have to measure and validate that when the 2023/24 version of the timetable has been created.
Putting this into practice
This exercise has always been about trying to make sure that the way we create our timetable is influenced, as much as possible, by the preferences of our students and staff. The survey results give a fairly clear steer on what those preferences are; the challenge now of course is to turn the results into a concrete outcome. And this is where the theory smashes slightly untidily into the practical reality.
One approach to resolve this would be to try to do this 'by the numbers'. We could maybe try to come up with a combined ranking by mashing the staff and student rankings together in some pseudo-justifiable possibly-arbitrarily-weighted way and declare victory. We think, however, that a little bit of creative thinking gets us to a much better outcome for everyone.
If we think about the scope for taking preferences into account as being some kind of 'flexibility budget' and implementing each preference as having some kind of 'cost' that's charged against that budget, hopefully it's clear that some of the preferences are more 'expensive' than others. For example, if the top choices had been 'minimise teaching on Mondays and/or Fridays', implementing this would quickly chew up all the available flexibility budget, and make accommodating any of the other preferences effectively impossible. Thankfullythat's not what's happened, and we think it should be possible to make-good several of the top choices of both staff and students for most people for most of the time.
Another untidy reality that we have accept is that some things are more expensive to achieve for students than they are for staff; and this is simply a consequence of the fact that there are a lot more students than staff, and an individual student will have many more hours of study delivered by several members of staff than most individual members of staff are scheduled to deliver teaching for.
Turning all of this into something concrete, in creating the guidance for building the timetable we've tried to balance three factors:
- How desirable a characteristic is; that is how high up the ranking it is for staff and students
- How practicable it is (which might be different for staff compared with students), and
- Whether there are other factors such as wellbeing or inclusivity to consider.
Where we've ended up for this first iteration is this: for staff and students, the timetabling process will prioritise:
- Distributing activities within the day to avoid more than 3 consecutive scheduled hours while also avoiding large gaps and allowing a lunch break between 12:00 and 14:00. These factors have the property of being highly desirable (towards the top of student and staff rankings), having important wellbeing and inclusivity implications, and are also for the most part achievable.
- Having achieved this where possible, the process will then attempt to minimise activities that start at 9am or finish at 6pm (something that's desirable for both staff and students, though somewhat harder to achieve in practice).
- In addition, it's really clear that the most important factor for staff - with 46% putting it in one of their top three choices -- is to avoid fragmentation of the week to allow for other aspects of the job to be carried out effectively. So for staff, the process will take into account, at the highest priority, the need to provide at least one day per week free of scheduled teaching. One of the slightly awkward outcomes of this exercise is, as well as being by far the most important feature for staff, 'maximise teaching-free days' actually came out fairly high in the student rankings as well. Given the amount of course unit choice the university offers, this one is just impractical to do much about for students; and arguably it was a mistake to include it in the student version of the survey. That said, it's a useful thing to note that students want, and perhaps something to keep an eye on in future.
Out of the 16 characteristics, this takes into account the first seven for both staff and students, which given the complexity we're dealing with here feels like a very satisfying outcome.
For the rest of the items in the lower section of the table the reality gets more messy: first there's very little agreement between staff and students on the ranking, but second and most importantly by the time the higher priority things have been taken into account as much can be, there will be very little budget left to accommodate them anyway so the lack of agreement over ranking doesn't really matter much. Perhaps third, and as a rider to the second point, as already mentioned some of the items (such as 'avoid teaching on day X') are super-expensive in terms of our notional budget and would only have any chance of being realistically achievable had they ended up right at the top of the rankings. The best that can be done with these then is to have them as a collection of features for the timetabling teams to consider in the (probably rare) cases where there is some scope to do so.
You can see how all of this is written into the Timetabling Code of Practice here, and the teams are now working on next year’s timetable which should be available in late August. I’ll report back on how this first run of the new process worked out with some stats on how the priorities were woven in after that.